How To Create Clickable HighChart In Laravel HTML
Integrating interactive charts into your Laravel application can enhance the user experience by making data visualization intuitive and engaging. Highcharts, a popular JavaScript charting library, offers extensive customization options, including clickable charts that can perform actions when clicked. This guide will walk you through the process of setting up a clickable Highcharts in a Laravel application.
What is Highcharts?
Highcharts is a powerful and flexible JavaScript library designed for creating interactive and customizable charts for web applications. It is widely used for data visualization, enabling developers to create various types of charts, such as line, bar, column, pie, scatter, and more, with minimal coding effort.
Key Features of Highcharts
-
Wide Range of Chart Types, Highcharts supports many chart types, including line, spline, area, column, bar, pie, scatter, bubble, and more. This variety allows developers to choose the best visual representation for their data.
-
Interactivity, Highcharts charts are interactive by default. Users can hover over data points to see tooltips, click on points to trigger actions, zoom in on specific areas, and more.
-
Customizability, Every aspect of a Highcharts chart can be customized, from the appearance of the axes and data points to the behavior of tooltips and legend items. This flexibility ensures that charts can be tailored to fit the specific needs and branding of any application.
-
Responsive Design, Highcharts charts are responsive and adapt to different screen sizes, ensuring a seamless experience on desktops, tablets, and smartphones.
-
Cross-browser Compatibility, Highcharts is compatible with all modern browsers, including Chrome, Firefox, Safari, Internet Explorer, and Edge, as well as mobile browsers.
-
Extensive API, Highcharts provides a comprehensive API that allows developers to control every aspect of the chart. The API includes methods for dynamically updating data, customizing the appearance, and handling events.
-
Accessibility, Highcharts includes features that improve accessibility, such as support for keyboard navigation and screen readers, ensuring that charts are usable by people with disabilities.
-
Integration with Popular Frameworks, Highcharts can be easily integrated with popular JavaScript frameworks like Angular, React, and Vue.js, as well as server-side languages like PHP, ASP.NET, and Python.
-
Exporting and Printing, Highcharts includes built-in functionality for exporting charts to various formats, such as PNG, JPEG, PDF, and SVG. It also supports printing directly from the browser.
-
Highstock and Highmaps, In addition to the core Highcharts library, Highsoft offers Highstock for financial charts and Highmaps for geographic and heatmap charts, providing even more specialized charting options.
Coding Time
Step 1: Setting Up the View
<div id="yourChart"></div>Step 2: Setting Up the JS file
<script>

// Convert your data to an object
const data = {
    y: [2, 3, 4, 5],
    name: ['a', 'b', 'c', 'd'],
    key: [1, 2, 3, 4]
}

Highcharts.chart('yourChart', {
      chart: {
          type: 'column'
      },
      credits: {
          enabled: false
      },
      title: {
          text: 'Your Chart Title',
          align: 'left'
      },
      yAxis: {
          min: 0,
          title: {
              text: 'Y Axis Title'
          }
      },
      xAxis: {
          type: 'category'
      },

      plotOptions: {
          series: {
              cursor: 'pointer',
              point: {
                  events: {
                      click: function() {
                          alert('Clicked');
                      }
                  }
              }
          }
      },

      series: [{
          name: 'Your Chart Name',
          data: data
      }]
  });
</script>
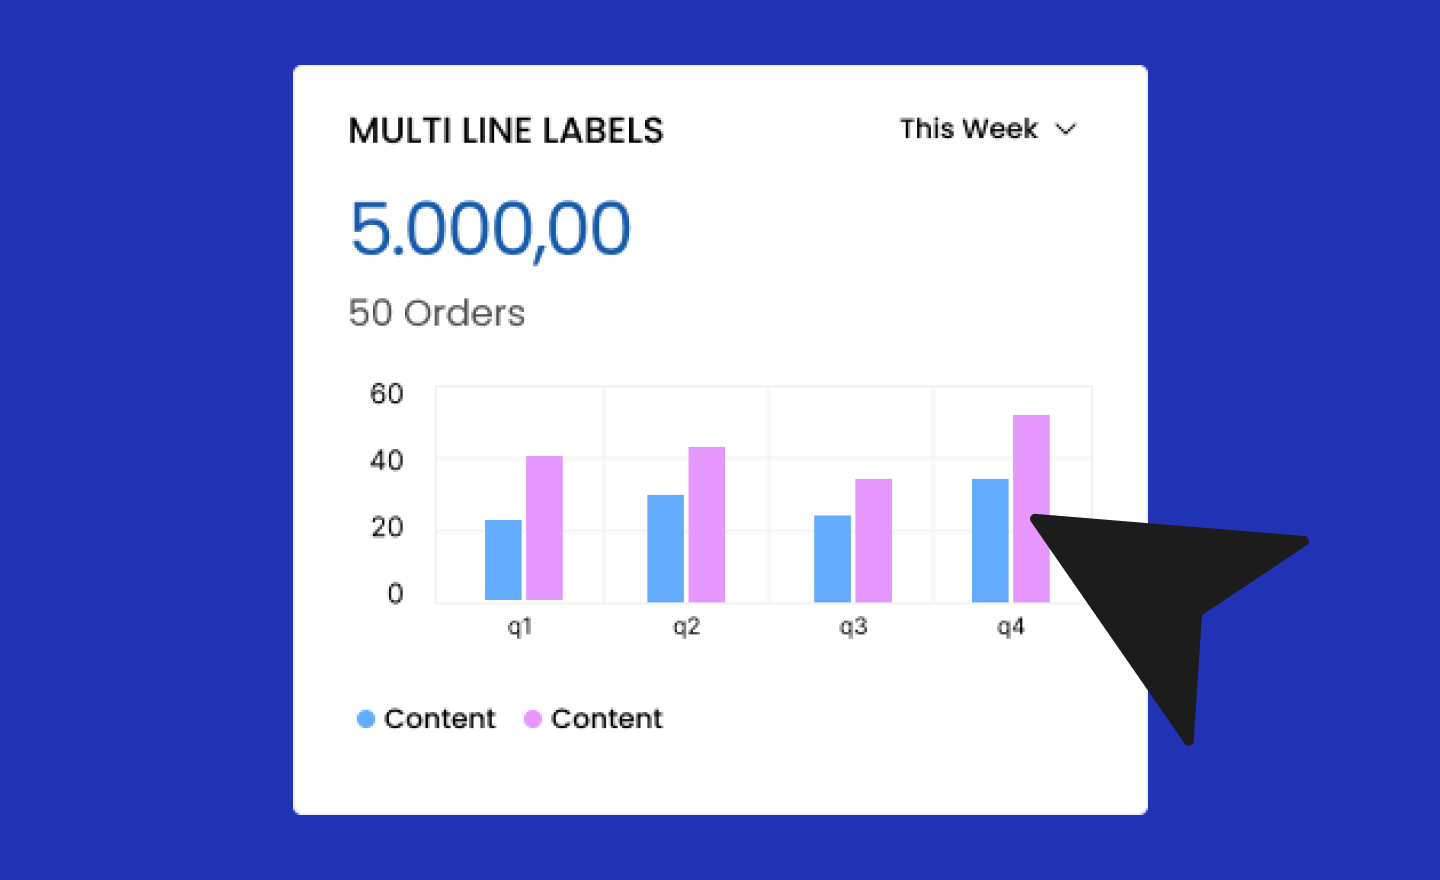
This is part of function for clickable bar chart.
plotOptions: {
    series: {
        cursor: 'pointer',
        point: {
            events: {
                click: function() {
                    alert('Clicked');
                }
            }
        }
    }
},
Convert your data to an object like this
const data = {
    y: [2, 3, 4, 5],
    name: ['a', 'b', 'c', 'd'],
    key: [1, 2, 3, 4]
}
Conclusion
You’ve successfully created a clickable Highcharts chart in a Laravel application. Highcharts’ extensive API allows you to further customize and enhance your charts, making your data visualization both interactive and informative. By integrating such features into your Laravel projects, you can provide a more dynamic and engaging experience for your users.
